-
How to open an FBS account?
Click the ‘Open account’ button on our website and proceed to the Personal Area. Before you can start trading, pass a profile verification. Confirm your email and phone number, get your ID verified. This procedure guarantees the safety of your funds and identity. Once you are done with all the checks, go to the preferred trading platform, and start trading.
-
How to start trading?
If you are 18+ years old, you can join FBS and begin your FX journey. To trade, you need a brokerage account and sufficient knowledge on how assets behave in the financial markets. Start with studying the basics with our free educational materials and creating an FBS account. You may want to test the environment with virtual money with a Demo account. Once you are ready, enter the real market and trade to succeed.
-
How to withdraw the money you earned with FBS?
The procedure is very straightforward. Go to the Withdrawal page on the website or the Finances section of the FBS Personal Area and access Withdrawal. You can get the earned money via the same payment system that you used for depositing. In case you funded the account via various methods, withdraw your profit via the same methods in the ratio according to the deposited sums.
Candlestick patterns
There are a lot of different candlestick patterns. When traders recognize these patterns on the chart, they act accordingly. As a result, the probability that a certain price action will follow a specific pattern is high.
Traders examine candlestick patterns through the visual analysis of the charts. There are also different pattern recognition indicators for MetaTrader. You can install them in your trading software. Still, even if an indicator or an expert advisor highlights the patterns on the charts for you, you will need to know what each pattern means.
There are two main types of candlestick patterns: reversal patterns and continuation patterns. As it’s evident from these names, they show the likely further direction of the market relative to the previous price action.
Reversal patterns
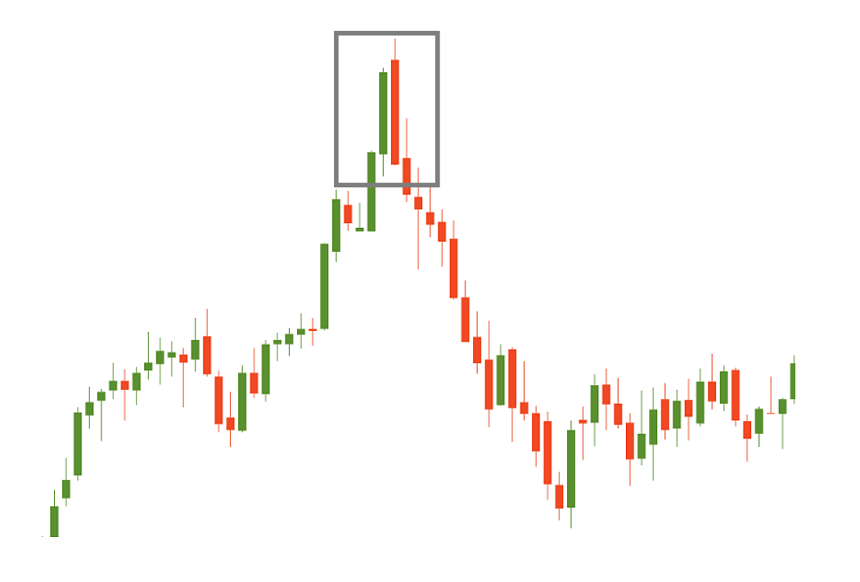
Reversal patterns indicate the high odds that a trend will change direction or make a deep correction. These patterns help to identify possible entry points at the beginning of the new trend or a big counter-trend move.
Not every reversal pattern has a similar weight. It’s very important where such a pattern took place and what happened before it. The reversal signal is strong in 2 cases:
- When the preceding trend is strong and steep.
- If a reversal candlestick pattern occurs near the strong resistance/support level.
In the picture below you can see an example of a strong reversal signal: the reversal candlestick pattern formed after a strong uptrend.
Continuation patterns
Continuation patterns suggest that the market will maintain an existing trend after a pause. These patterns help to find a new entry point in line with a trend, as well as provide evidence for holding the already open positions or adding to them.
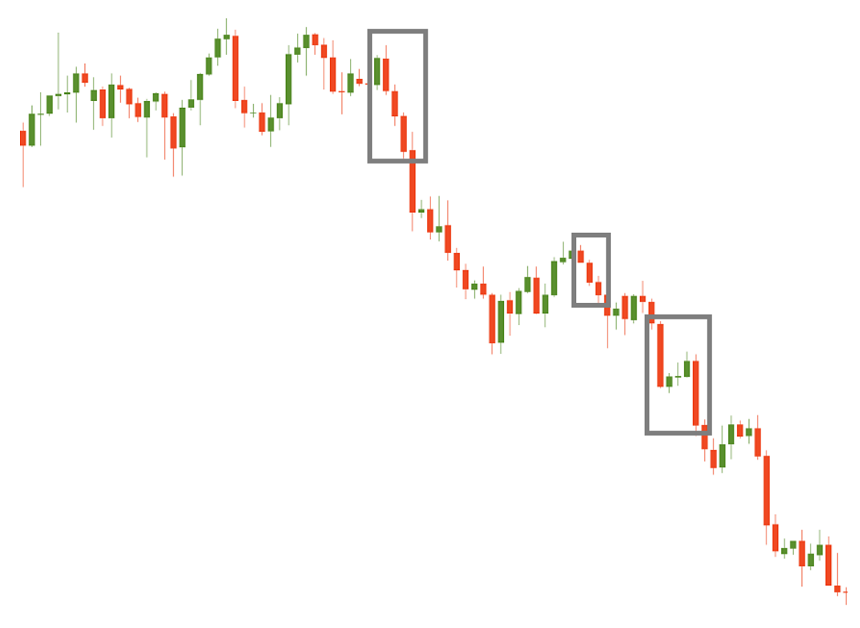
Notice that reversal patterns are easier to recognize than the continuation ones. As a result, for beginner traders, we recommend starting learning the patterns from the reversal ones.
It’s also possible to break the candlestick patterns into bullish and bearish ones. In most cases, they represent the mirror images of each other.
In the following tutorials, we explain the most popular reversal and continuation candlestick patterns.

2023-05-25 • Updated
Other articles in this section
- Fibonacci fan
- Fibonacci expansion
- How to Use Fibonacci Retracements
- Reversal candlestick patterns
- Continuation candlestick patterns
- How to deal with market noise?
- How to backtest a trading strategy
- Gator Oscillator
- Market Facilitation Index
- Accelerator Oscillator
- Awesome Oscillator
- Ranges
- Alligator indicator
- Bill Williams theory
- Fractals
- Chart patterns
- Uncovering Gann indicators
- How to create your own trading strategy?
- Trend trading
- Carry trade
- Swing trading
- Position trading
- Day trading
- Scalping
- Fibonacci tools
- Trader's psychology
- How to identify market reversal
- Japanese Candlesticks
- Trends


