-
How to open an FBS account?
Click the ‘Open account’ button on our website and proceed to the Personal Area. Before you can start trading, pass a profile verification. Confirm your email and phone number, get your ID verified. This procedure guarantees the safety of your funds and identity. Once you are done with all the checks, go to the preferred trading platform, and start trading.
-
How to start trading?
If you are 18+ years old, you can join FBS and begin your FX journey. To trade, you need a brokerage account and sufficient knowledge on how assets behave in the financial markets. Start with studying the basics with our free educational materials and creating an FBS account. You may want to test the environment with virtual money with a Demo account. Once you are ready, enter the real market and trade to succeed.
-
How to withdraw the money you earned with FBS?
The procedure is very straightforward. Go to the Withdrawal page on the website or the Finances section of the FBS Personal Area and access Withdrawal. You can get the earned money via the same payment system that you used for depositing. In case you funded the account via various methods, withdraw your profit via the same methods in the ratio according to the deposited sums.
Ichimoku
Ichimoku Kinko Hyo (IKH) or simply Ichimoku is a very useful and informative technical indicator. It’s name is translated from Japanese as a “glance at a chart in equilibrium”. The idea is that you will learn everything you need to know about the state of the market with just one sight on a chart containing this indicator.
The Ichimoku indicator performs several important tasks. It:
- marks the direction of the dominant trend;
- shows momentum and strength of a trend;
- provides reliable support and resistance levels;
- gives trade signals.
At first, this indicator may look intimidating but when you know it you will find it rather simple and invaluable in market analysis.
In the following tutorial, we will tell you about the elements of Ichimoku and the signals they produce. We will explain how to analyze the market with this technical tool.
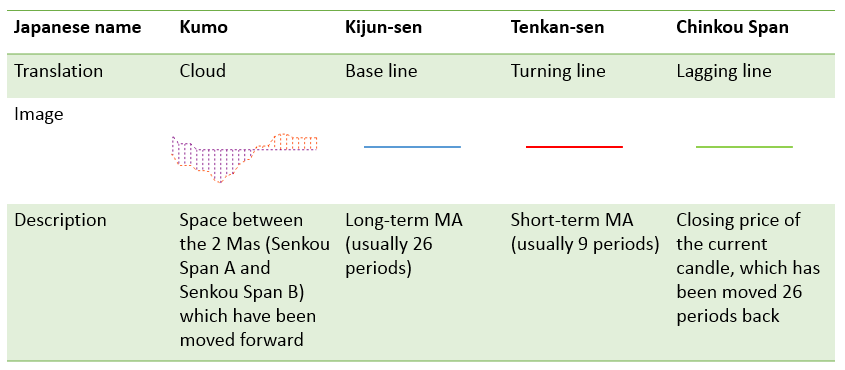
The elements of Ichimoku
The indicator is based on moving averages which have some modifications. Its lines have traditional Japanese names as well as conventional modern ones.
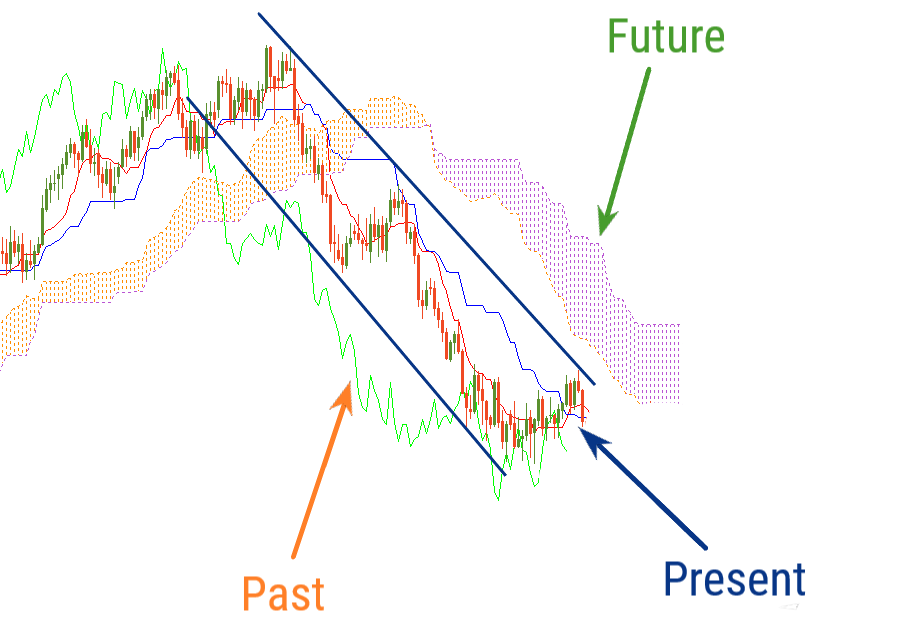
Have a look at the example of the Ichimoku indicator on the chart. We can distinguish the 3 layers — the past, the present, and the future.
'Present' of Ichimoku indicator
Let’s start with the so-called “present”. It’s characterized by 2 lines — Kijun and Tenkan. Of these two, Kijun (the base line) is a moving average with a bigger period. As a result, it measures medium-term momentum and has more weight than Tenkan. The price crosses Tenkan more often than Kijun, and if the price does cross Kijun, it signals changes in the market.
'Future'
The “future” is represented by the Ichimoku Cloud. The cloud is formed by the 2 moving averages which are shifted forward. If the moving average with the bigger period (Senkou Span B) is below the moving average with a smaller period (Senkou Span A), the Cloud is considered bullish. Its color is usually light. If Senkou Span B is above Senkou Span A, the Cloud is considered bearish. Such Cloud often has a darker color. Bullish Cloud means that buyers dominate the market, while bearish Cloud shows that sellers are in control. You can see that the Cloud changes color from time to time reflecting the shifts of power from bulls to bears and back. The width of the Cloud matters: the wider the bearish Cloud, the stronger are the sellers. To understand the current power balance of the market, look at the part of the Cloud that is “in the future”, i.e. to the right of the current price. As for the part of Cloud, which is aligned with the current prices, it acts as support and resistance for the price.
'Past'
In the “past”, there’s a single line called Chinkou Span. Unlike the other Ichimoku lines, it’s not a moving average, but simply a price chart moved a number of periods back so that it lags behind the market. The way this line interacts with the price chart itself offers hints for traders.
Why are some elements of the indicator switched forward and some are placed backward? Firstly, it would be very difficult to read the chart if all the 5 lines were in the same area. In addition, this way the elements of Ichimoku indicator produce trade signals. The following tutorial will show you how to interpret these signals.
How to implement Ichimoku
To apply Ichimoku to a chart in Metatrader, click “Insert”, choose “Indicators”, and pick “Custom”, then “Ichimoku”. In the settings, you can choose values for Tenkan, Kijun and Senkou Span B. You can also adjust the colors the indicator’s lines according to your preferences.
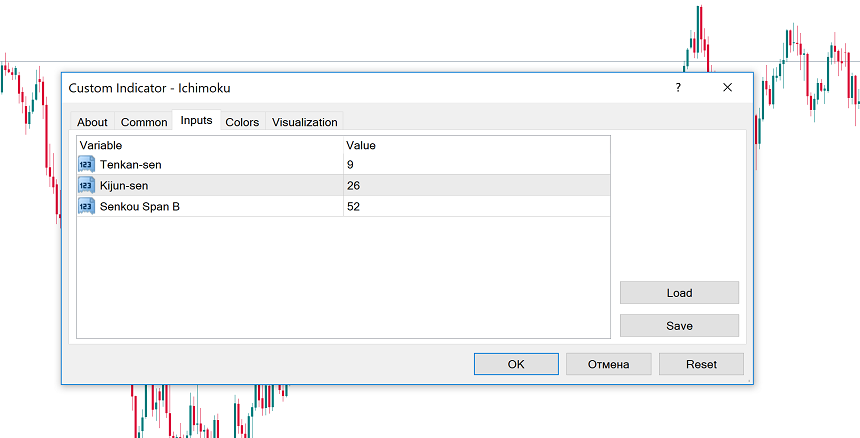
The default settings 9-26-52 are the original parameters proposed by the indicator’s developer. They are popular among traders and can be used on any timeframe. At the same time, you are also free to adjust the default settings. The key thing is to choose the increasing values so that the figure for Tenkan-sen is the smallest and the value for Senkou Span B is the biggest.
Trading with Ichimoku
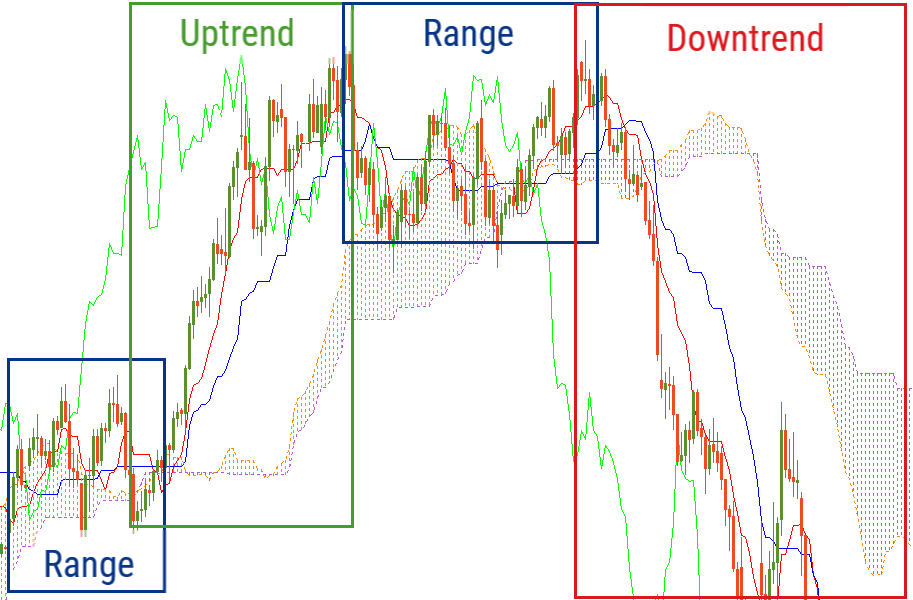
The position of Ichimoku lines can give traders a clear view of the existing trends. When the market is sideways, the indicator lines are horizontal so that the price is fluctuating around them. The Cloud is thin and changes its color often.
If the price is above the Cloud, Tenkan and Kijun and the bullish Cloud is solid, it’s an uptrend. Chinkou Span will be above the price in this case.
If the price is below the Cloud, Tenkan and Kijun and the bearish Cloud is solid, it’s a downtrend. Chinkou Span will be below the price in this case.
The Ichimoku lines produce trade signals by crossing each other and the price, that why there are many different signals in the table below. Notice that when a new trend starts, signals from different elements of the indicator tend to appear around the same time and point in one direction.
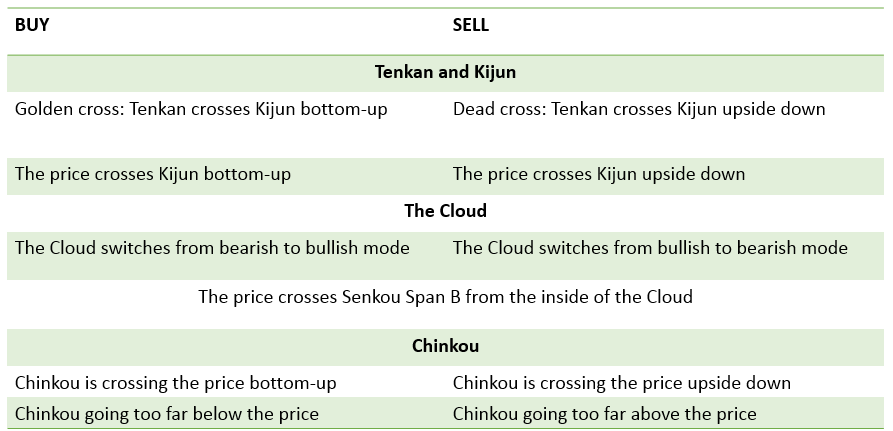
Ichimoku trading signals
Let’s review an example of how Ichimoku provides trade signals.
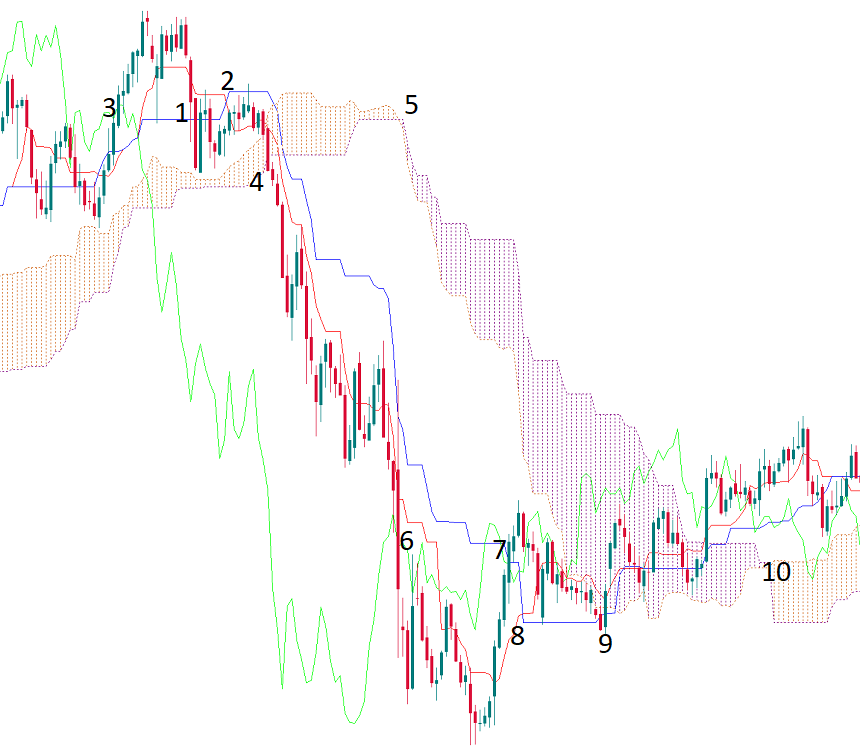
1 - The price went below Kijun-sen. It’s a first bearish signal.
2 - Tenkan-sen fell below Kijin-sen.
3 - Chinkou Span crossed the price chart to the downside.
4 - The price broke below the Ichimoku Cloud.
5 - The Cloud switched from bullish to bearish.
The signals 2-4 appeared around the same time and signaled the start of a bearish trend. They point at the opportunity to open a sell trade. The lines of the indicator then acted as resistance for the price.
6 - Chinkou Span broke back above the price chart. It’s possible to take profit from a short position.
7 - The price went above Kijun-sen.
8 - Tenkan-sen went above Kijun-sen.
9 - The thick bearish Ichimoku Cloud acted as resistance for the price but it finally managed to break in.
10 - The Cloud switched from bearish to bullish. The price went above the Cloud. There are indications of an emerging uptrend, although, given the fact that Chinkou Span corrected to the price chart, there may also be a sideways trend for some time.
Conclusion
The Ichimoku indicator represents a complete trading system. It’s possible to use just this indicator for trading. You can use it to identify trends, check for support and resistance levels as well as get entry signals. You can customize the indicator’s settings and use it together with other tools of technical analysis.

2023-05-08 • Updated
Other articles in this section
- Structure of a Trading Robot
- Building a Trading Robot without Programming
- How to Launch Trading Robots in MetaTrader 5?
- Algorithmic Trading: What Is It?
- Fibonacci Ratios and Impulse Waves
- Guidelines of Alternation
- What is a triangle?
- Double Three and Triple Three patterns
- Double Zigzag
- Zig Zag and Flat Patterns in Trading
- Advanced techniques of position sizing
- Truncation in the Elliott Wave Theory
- What is an extension?
- Ending Diagonal Pattern
- How to trade gaps
- Leading diagonal pattern
- Wolfe waves pattern
- Three drives pattern
- Shark
- Butterfly
- Crab Pattern
- Bat
- Gartley
- ABCD Pattern
- Harmonic patterns
- What is an impulse wave?
- Motive and corrective waves. Wave degrees
- Introduction to the Elliott Wave Theory
- How to trade breakouts
- Trading Forex news
- How to place a Take Profit order?
- Risk management
- How to place a Stop Loss order?
- Technical indicators: trading divergences


