
Unemployment Rate and Nonfarm Payrolls: Why They Are So Important for the Markets
This article is about the nature of one of the most potent fundamental indicators, Nonfarm payrolls.
2023-01-25 • Updated
In “Trading psychology: see it right, part 1” we have taken an abstract and rather philosophical view at the chart analysis, questioning the validity and relevance of resistance and support levels. In this Part 2, we will be more technical and specific in our effort to show the importance of precision, study, and detailed examination in chart analysis.
Ok, so you are saying that none of those support or resistance levels exist in reality and that traders just see something that appears fair to them and place their levels based on those appearances?
Yes, but don’t get me wrong. With certain trade items, certain levels do exist, or at least it makes sense if they do. For example, with the oil price there are certain levels beyond which extracting crude doesn’t pay off. So for each oil-producing company and country, there is a price level below which production makes no profit. For example, you know that – roughly speaking – Saudi Aramco’s breakeven oil price is $10. Below it, it will run losses. Of course, in this case, Saudi Arabia as the central OPEC player will do everything possible to support the price and push it above $10. Strategically, it makes sense. Knowing that, you may put $10 as a support level for the oil price because you know that in the minds of certain powerful people on the market this $10 will be a mental barrier which they will be defending. In this case, it will be a true reason for those people to act on, and as such, an internal reason for the market to behave in a certain manner. But what you did with gold putting $1,642 makes little sense – what is there at $1,642?
And the same with the currencies?
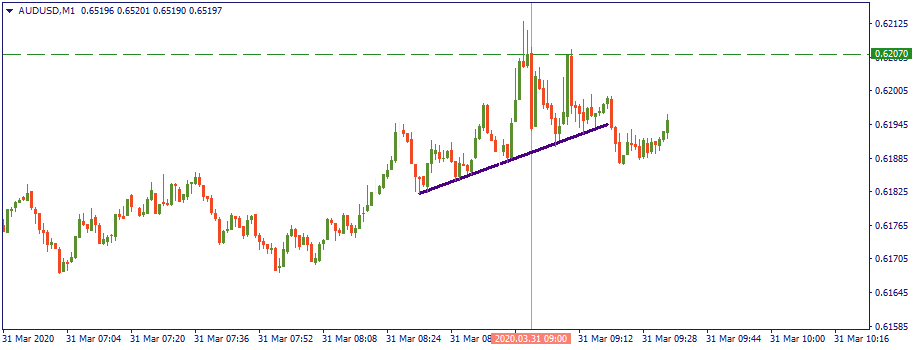
Even more so with the currencies. Look at the news: they say, for example, the AUD/USD approaches 0.6207 – so what? It’s just the closest milestone I can put in the way of the price. I chose it to be so, I can choose anywhere else to put it.
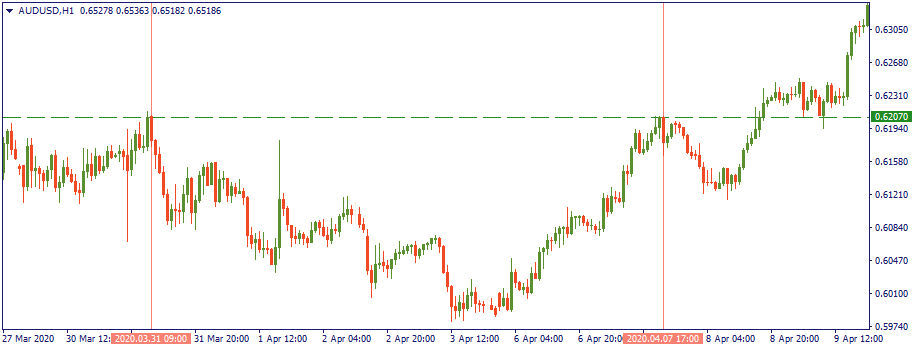
No, wait. It’s objectively resisting the price to move upwards. Look, the price touched it on March 31, and then reversed exactly at the same level on April 7.
The price moves downwards hundreds of times a day, thousands of times a week, etc. You cannot take just two observations out of thousands and assign to these observations “special powers”. With the same logic, I can put as many levels as I want, anywhere. In the end, any line requires just two points to be drawn through. But let’s say, there is really something special about the AUD/USD at 0.6207. What is that level?
It’s a level above which the price did not move several times. It reversed downwards at that height.
No problem. Let’s look at one of those reversals a bit closer: let’s take March 31. I’m showing it to you exactly as if you were looking at the chart right at that minute. What do you see? The price bounced down from that 0.6207, but would you think at that moment that it would later become a true reversal? Unlikely.
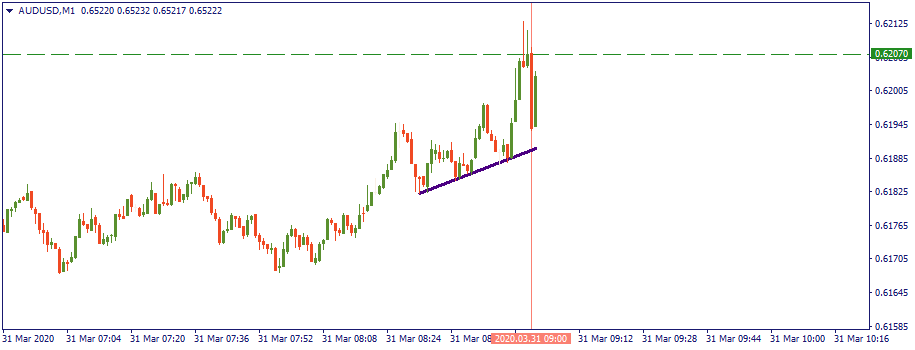
There is just increased volatility, but little sign of a reversal. But let’s say you are smart so you wait another couple of minutes. This is what you see next: the price bounced down again from that supposed resistance at 0.6207, but still – is there a sign of reversal? The trend is still looking upwards.
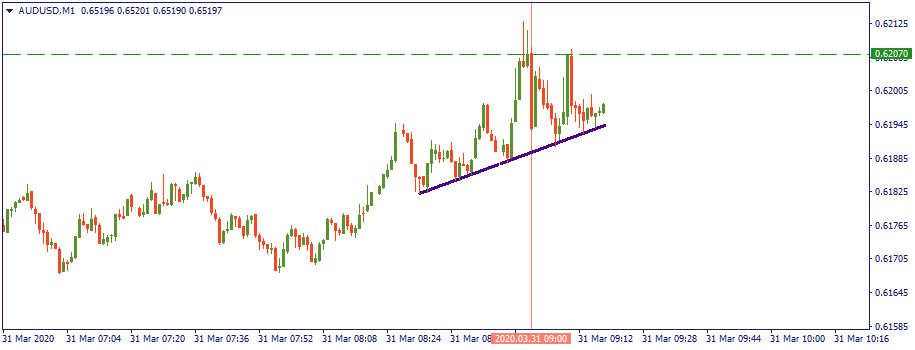
Even if you look at the chart after the price went below this marked upward mini-trend, still the overall picture is more bullish than bearish.
Ok, what do you want to say then?
I want to say that if you want to see levels – you will; basically, anywhere you want. Objectivity here is as relative as arbitrary for one part, and for another – it requires checking through many timeframes to make sure you are precise. Precision in Forex Is 50% of success, and it is attainable with time, research, patience, and consistency. That is the main takeaway here: don’t be arbitrary; try to be objective. For that, be patient and persistent on the path of your chart analysis.

This article is about the nature of one of the most potent fundamental indicators, Nonfarm payrolls.

In trading, we can rely on a bunch of different entry signals.

A triangle chart pattern is a consolidation pattern that involves an asset price moving within a gradually narrowing range.
Click the ‘Open account’ button on our website and proceed to the Personal Area. Before you can start trading, pass a profile verification. Confirm your email and phone number, get your ID verified. This procedure guarantees the safety of your funds and identity. Once you are done with all the checks, go to the preferred trading platform, and start trading.
If you are 18+ years old, you can join FBS and begin your FX journey. To trade, you need a brokerage account and sufficient knowledge on how assets behave in the financial markets. Start with studying the basics with our free educational materials and creating an FBS account. You may want to test the environment with virtual money with a Demo account. Once you are ready, enter the real market and trade to succeed.
The procedure is very straightforward. Go to the Withdrawal page on the website or the Finances section of the FBS Personal Area and access Withdrawal. You can get the earned money via the same payment system that you used for depositing. In case you funded the account via various methods, withdraw your profit via the same methods in the ratio according to the deposited sums.
FBS maintains a record of your data to run this website. By pressing the “Accept” button, you agree to our Privacy policy.
Your request is accepted.
A manager will call you shortly.
Next callback request for this phone number
will be available in
If you have an urgent issue please contact us via
Live chat
Internal error. Please try again later
Don’t waste your time – keep track of how NFP affects the US dollar and profit!
|


